Local Workforce Development Areas (LWDA)
LWDA XI
November 2018Maps and an excel file provide labor force data such as employment and unemployment rates by census tract for LWDA XI.
The PDF contains three maps. Use the scroll or arrow keys to view each map. The first map shows the counties that make up LWDA XI, the second map shows the unemployment rates by census tract for that LWDA, and the third map shows areas of significant unemployment. LWDA and State averages on each map are consistent with the census tract five-year averages.
Click to access excel data: LWDA 11
LWDA IX
November 2018Maps and an excel file provide labor force data such as employment and unemployment rates by census tract for LWDA IX.
The PDF contains three maps. Use the scroll or arrow keys to view each map. The first map shows the counties that make up LWDA IX, the second map shows the unemployment rates by census tract for that LWDA, and the third map shows areas of significant unemployment. LWDA and State averages on each map are consistent with the census tract five-year averages.
Click to access excel data: LWDA 9
LWDA VIII
November 2018Maps and an excel file provide labor force data such as employment and unemployment rates by census tract for LWDA VIII.
The PDF contains three maps. Use the scroll or arrow keys to view each map. The first map shows the counties that make up LWDA VIII, the second map shows the unemployment rates by census tract for that LWDA, and the third map shows areas of significant unemployment. LWDA and State averages on each map are consistent with the census tract five-year averages.
Click to access excel data: LWDA 8
LWDA VII
November 2018Maps and an excel file provide labor force data such as employment and unemployment rates by census tract for LWDA VII.
The PDF contains three maps. Use the scroll or arrow keys to view each map. The first map shows the counties that make up LWDA VII, the second map shows the unemployment rates by census tract for that LWDA, and the third map shows areas of significant unemployment. LWDA and State averages on each map are consistent with the census tract five-year averages.
Click to access excel data: LWDA 7
LWDA VI
November 2018Maps and an excel file provide labor force data such as employment and unemployment rates by census tract for LWDA VI.
The PDF contains three maps. Use the scroll or arrow keys to view each map. The first map shows the counties that make up LWDA VI, the second map shows the unemployment rates by census tract for that LWDA, and the third map shows areas of significant unemployment. LWDA and State averages on each map are consistent with the census tract five-year averages.
Click to access excel data: LWDA 6
LWDA IV
November 2018Maps and an excel file provide labor force data such as employment and unemployment rates by census tract for LWDA IV.
The PDF contains three maps. Use the scroll or arrow keys to view each map. The first map shows the counties that make up LWDA IV, the second map shows the unemployment rates by census tract for that LWDA, and the third map shows areas of significant unemployment. LWDA and State averages on each map are consistent with the census tract five-year averages.
Click to access excel data: LWDA 4
LWDA III
November 2018Maps and an excel file provide labor force data such as employment and unemployment rates by census tract for LWDA XIV.
The PDF contains three maps. Use the scroll or arrow keys to view each map. The first map shows the counties that make up LWDA XIV, the second map shows the unemployment rates by census tract for that LWDA, and the third map shows areas of significant unemployment. LWDA and State averages on each map are consistent with the census tract five-year averages.
Click to access excel data: LWDA 3
LWDA II
November 2018Maps and an excel file provide labor force data such as employment and unemployment rates by census tract for LWDA II.
The PDF contains three maps. Use the scroll or arrow keys to view each map. The first map shows the counties that make up LWDA II, the second map shows the unemployment rates by census tract for that LWDA, and the third map shows areas of significant unemployment. LWDA and State averages on each map are consistent with the census tract five-year averages.
Click to access excel data: LWDA 2
LWDA I
November 2018Maps and an excel file provide labor force data such as employment and unemployment rates by census tract for LWDA I.
The PDF contains three maps. Use the scroll or arrow keys to view each map. The first map shows the counties that make up LWDA I, the second map shows the unemployment rates by census tract for that LWDA, and the third map shows areas of significant unemployment. LWDA and State averages on each map are consistent with the census tract five-year averages.
Click to access excel data: LWDA 1
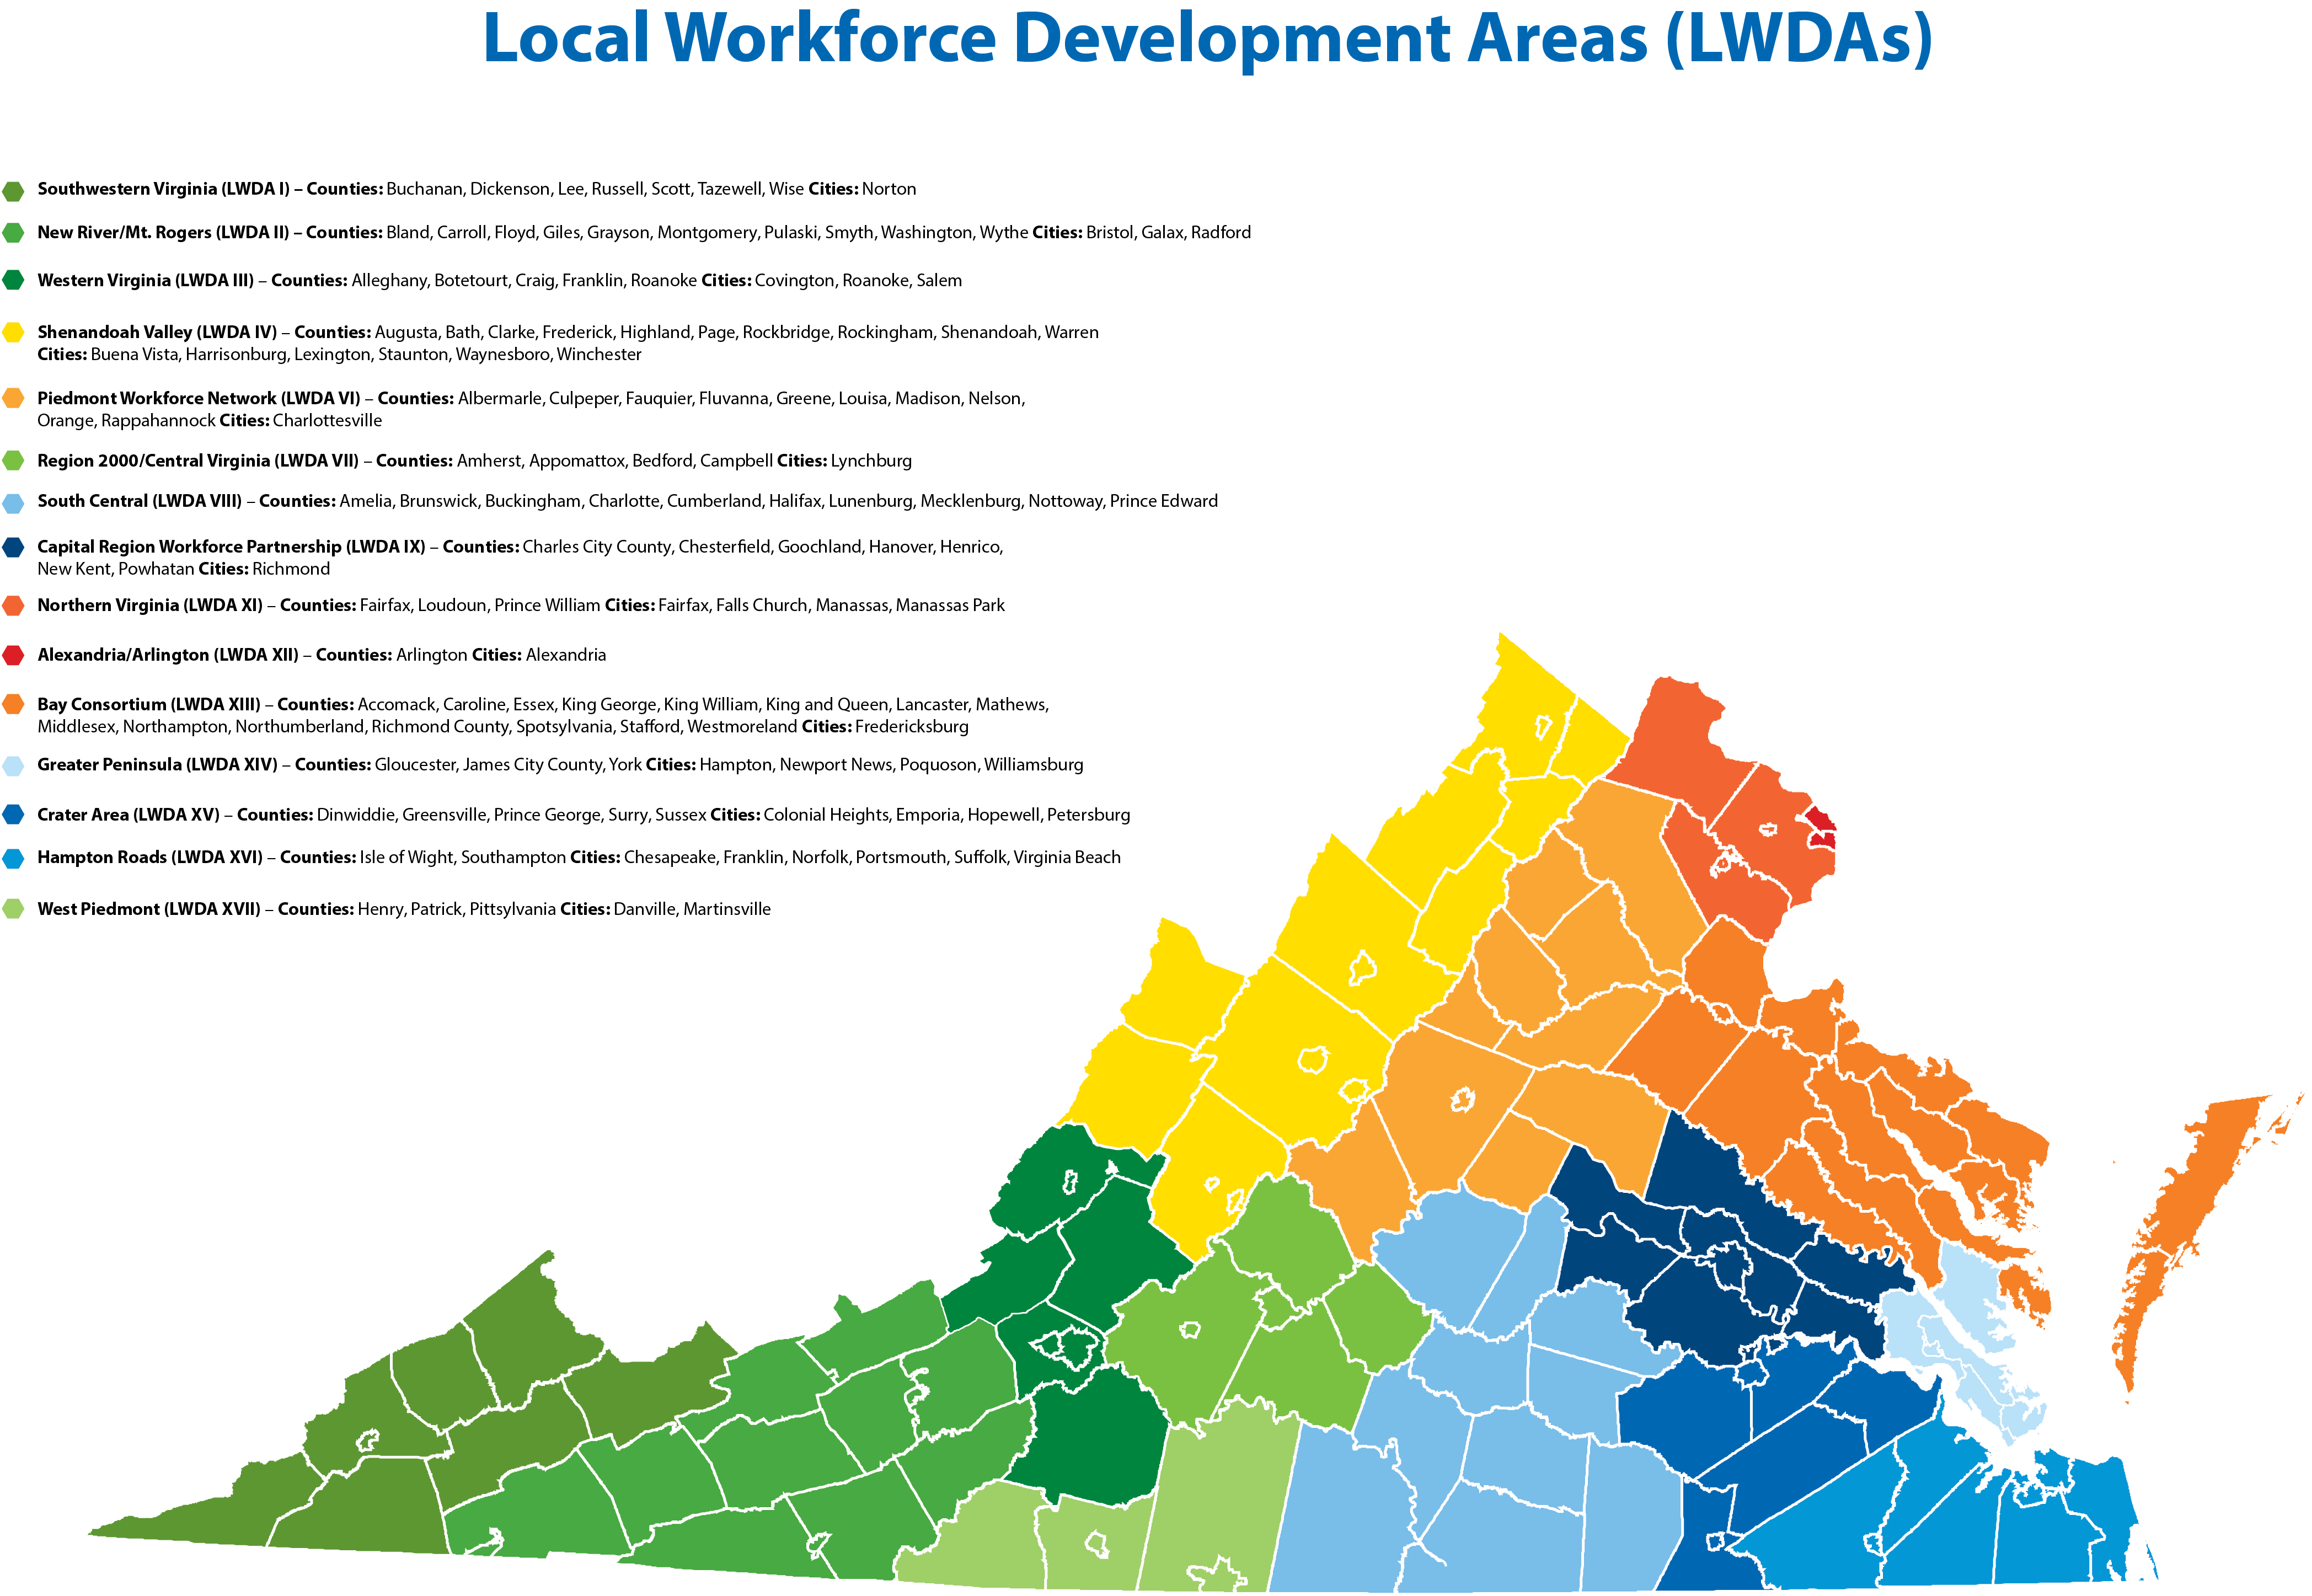
Local Workforce Development Areas (LWDAs)
November 2018Map showing all the LWDAs in the state.

LWDA XVII
November 2018Maps and an excel file provide labor force data such as employment and unemployment rates by census tract for LWDA XVII.
The PDF contains three maps. Use the scroll or arrow keys to view each map. The first map shows the counties that make up LWDA XVII, the second map shows the unemployment rates by census tract for that LWDA, and the third map shows areas of significant unemployment. LWDA and State averages on each map are consistent with the census tract five-year averages.
Click to access excel data: LWDA 17
LWDA XVI
November 2018Maps and an excel file provide labor force data such as employment and unemployment rates by census tract for LWDA XVI.
The PDF contains three maps. Use the scroll or arrow keys to view each map. The first map shows the counties that make up LWDA XVI, the second map shows the unemployment rates by census tract for that LWDA, and the third map shows areas of significant unemployment. LWDA and State averages on each map are consistent with the census tract five-year averages.
Click to access excel data: LWDA 16
LWDA XV
November 2018Maps and an excel file provide labor force data such as employment and unemployment rates by census tract for LWDA XV.
The PDF contains three maps. Use the scroll or arrow keys to view each map. The first map shows the counties that make up LWDA XV, the second map shows the unemployment rates by census tract for that LWDA, and the third map shows areas of significant unemployment. LWDA and State averages on each map are consistent with the census tract five-year averages.
Click to access Excel data: LWDA 15
LWDA XIV
November 2018Maps and an excel file provide labor force data such as employment and unemployment rates by census tract for LWDA XIV.
The PDF contains three maps. Use the scroll or arrow keys to view each map. The first map shows the counties that make up LWDA XIV, the second map shows the unemployment rates by census tract for that LWDA, and the third map shows areas of significant unemployment. LWDA and State averages on each map are consistent with the census tract five-year averages.
Click to access excel data: LWDA 14
LWDA XIII
November 2018Maps and an excel file provide labor force data such as employment and unemployment rates by census tract for LWDA XIII.
The PDF contains three maps. Use the scroll or arrow keys to view each map. The first map shows the counties that make up LWDA XIII, the second map shows the unemployment rates by census tract for that LWDA, and the third map shows areas of significant unemployment. LWDA and State averages on each map are consistent with the census tract five-year averages.
Click to access excel data: LWDA 13
LWDA XII
November 2018Maps and an excel file provide labor force data such as employment and unemployment rates by census tract for LWDA XII.
The PDF contains three maps. Use the scroll or arrow keys to view each map. The first map shows the counties that make up LWDA XII, the second map shows the unemployment rates by census tract for that LWDA, and the third map shows areas of significant unemployment. LWDA and State averages on each map are consistent with the census tract five-year averages.
Click to access excel data: LWDA 12